.png)
.png)
8 Essential B2B Reports Every Wholesaler Needs




Updated on September 18, 2026, to include additional reports.
Key Takeaways
- B2B reports and reporting tools reveal what drives revenue, customer engagement, and operational efficiency.
- Turning wholesale data into insight can help teams improve sales performance, prioritize customer follow-up, plan inventory, and support cash flow.
- Built-in reports support consistent monitoring, while AI assistants can help teams investigate follow-up questions across approved customer, order, product, and pricing data.
Remember when wholesale sales and marketing teams relied on gut feeling and industry whispers to bring in leads, close deals, and build repeat business? Those days feel like they belong to the Mad Men era.
As digitization, B2B eCommerce platforms, and AI tools reshape the landscape, success relies heavily on data. But having loads of data at your disposal isn’t an inherent advantage. What really matters is what you analyze, how you interpret it, and how you turn it into actionable insight. As a result, B2B reporting tools have become vital for success, turning numbers into clearer decisions.
To grow your wholesale business, treat data as a secret weapon. When you harness the insights hidden in your numbers, your business can truly thrive.
In this article, we’ll explore how eight essential B2B reports and AI-assisted analysis turn raw data into actions that deliver quick wins, answer the follow-up questions these reports raise, and nurture sustainable growth.
Why B2B Reporting Tools Are Essential for Wholesale Success
Running a wholesale business is like being a maestro: every part of the operation has to move in harmony. Plus, you have to catch the missteps. You’re conducting sales teams, managing inventory, balancing customer demands, syncing shipping timelines, and keeping the books steady.
In the past, tracking all that meant jumping between spreadsheets, relying on phone calls, and guessing a fair bit. But today, B2B eCommerce platforms with built-in reporting tools have changed that. Instead of facing chaos, you can now orchestrate clarity. B2B reports give you a clear view of your business’s rhythm.

8 Essential B2B Reports at a Glance
1. Sales Reps’ Performance Reports: Turn Team Data Into Growth
One of the most powerful B2B reports tracks your sales team’s performance, showing who’s closing the biggest deals and who might need support.
What You’ll Learn
- Star players: Which reps are bringing their A game, generating the highest revenue and average order value.
- Performance gaps: Which team members are falling behind on their goals and may need support.
Apply the Insight
- Coach with data: Spot your top performers and study their order-line patterns to coach your entire team: Are they selling more high-value products or broader product mixes? Do their order patterns suggest effective cross-selling or down-selling that helps customers keep ordering?
- Provide support: Check in with struggling reps and provide additional incentives or training to improve performance. For instance, show them how to craft smarter offers for customers—within your profit margin.
- Analyze incentives: Does your commission structure motivate the right sales behavior? Review order-line breakdowns and use available filters to review products, net prices, order discounts, and commission amounts by rep and get to the bottom of it. From there, assess whether your incentive structure supports the outcomes you want. For example, you can see whether reps rely heavily on discounts to close high-value orders.
2. Customers Performance Reports: Know Your Customers (And Keep Them Engaged)
Successful wholesalers do one thing well: they know their customer. Yet, many wholesalers don’t have a full picture of where each customer stands, leaving many relationships unattended. Customer churn is invisible until it’s too late. Modern B2B eCommerce platforms make this data visible at a glance.
What You’ll Learn
- Top customers: Who your most active and high-spending customers are, based on order frequency and total order value.
- Churn risk indicators: Which accounts might be slipping away, based on declining order activity and order size.
- Historic customer behavior: Explore how buyer habits change over specific date ranges, “signaling” their loyalty and future value.
Apply the Insight
- Customer tiers: Identify your top customers, segment them into tiers (e.g., Platinum, Gold), and personalize offers, product access, or pricing.
- Strategic segmentation: Check company activity and tailor your sales approach to its business type, ensuring the best service level for everyone. For example, a retailer may have a smaller order size but a higher frequency, while a distributor may place larger —though more sporadic—orders. Volume discounts make sense in the second case, but not in the first.
- Proactive retention: Discover accounts with declining activity and have your team reach out immediately with personalized offers, updated catalogs, or quick check-ins before they defect to a competitor.
3. Customer Activity Reports: Decode Buyer Behavior
Sales success comes from understanding what your customers do and which of your products or services matter to them. For wholesalers ready to move beyond basic sales history from your wholesale website, this report offers a decisive advantage. Imagine seeing which products your buyers browse and what they search for most — it’s like having a window into their decision-making process.
What You’ll Learn
- Product & category traction: Which products and categories buyers are viewing or engaging with—not only on your wholesale website but also in their custom PDF catalog.
- Active explorers: Which customers are actively exploring your catalog, and how their product preferences change over time.
- Login activity: Which customers have logged into your B2B portal and when.
- Search gaps: Which products and categories buyers search for most often, or which products they tried to order beyond available quantity, indicating potential unmet demand or navigation issues.
Apply the Insight
- Personalized outreach: Use these insights to tailor sales and marketing outreach. If certain customers frequently view a category but don’t place orders, reach out to them to address technical questions, understand their hesitations, or present targeted offers.
- Capture buyers’ interest: Monitor views or searches for products following any major external communication (like a newsletter on new floor finishes) to get a rough pulse check of immediate buyer interest.
- Build customers’ dream B2B storefronts: Fine-tune your website for each buyer with suggested listings or discounts based on what they’ve searched for or engaged with.
- Refine your sales strategy: Pair insights from this report with customer performance and product sales data to gain a 360-degree view of your sales. Do you need to retool your approach for specific customers or products?

4. Product Sales Reports: Know What’s Driving Revenue
In commerce, every product tells a story. Some are customer favorites that drive consistent revenue. Others spike seasonally (e.g., pharmacies stock up on Vitamin C during flu season). And then there are a few that just don’t get the traction you expected (maybe that “sun protection water” wasn’t quite the hit you hoped for). That’s where a Product Sales report comes in.
What You’ll Learn
- Revenue magnets: Which products, categories, or brands are generating the highest sales value, and which ones aren’t moving.
- Demand indicators: Spot product seasonality, trends, and category performance to guide sales and marketing opportunities.
- “Dead weight” stock: Identify slow-moving or unsold products that may be occupying valuable warehouse space.
Apply the Insight
- Inventory cleanup: Filter product sales to include unsold products and in-stock variants. Decide whether to discount them, bundle them with star products, or discontinue them to free up working capital.
- Catalog check: Use this data to understand where your catalog is missing out: Is a product underperforming because it’s buried too deep in your B2B store, buyers don’t understand the value it brings, or the price point is too high?
5. Customer Product Sales Reports: See Who Buys What
Knowing which products sell is useful. Knowing which customers buy them (and when) makes that information much more actionable. A Customer Product Sales report connects product performance with individual customer activity, giving you a clearer view of purchasing patterns.
What You’ll Learn
- Preferred products by customer: See which products, categories, and brands each customer purchases.
- Buying patterns: Review order dates, quantities, prices, and product sales values to identify repeat purchases or changes in order behavior.
Apply the Insight
- Plan relevant offers and product suggestions: Use purchasing history to introduce relevant new products and create more targeted promotions. You can also compare product preferences across similar accounts to identify cross-selling opportunities and recommend complementary products.
- Support reordering: Filter previous order dates and review orders and quantities, then use that context when discussing restocks or future needs with customers.
6. Inventory Control Reports: Optimizing Cash Flow and Stock Health
It is a truth universally acknowledged that stockouts and overstocks are a common source of frustration for wholesalers. A B2B inventory report gives you the tools to manage your inventory like a pro. This insight is essential to keep your capital healthy and flowing, not tied up in stagnant SKUs.
What You’ll Learn
- Inventory value: See the value of available stock compared with the value of sold products to understand how much capital remains tied up in inventory.
- Gross margin visibility: Compare product cost with sales value to estimate gross profit and gross margin per SKU.
- Stockout prevention: See which products are close to your minimum quantity threshold to decide whether to replenish, clear out, or discontinue.
- Inventory management decisions: Explore which products are moving slowly or carry high inventory value. This intel helps you decide whether to adopt different inventory practices, such as backordering, vendor-managed inventory (VMI), or other just-in-time methods, to free up capital.
Apply the Insight
- Reduce overstock risk: Monitor inventory value per category to see where you may be “bleeding” cash. For example, you can set up clearance sales or discontinue codes that are moving slowly off your shelves.
- Set safety stock: Check the minimum quantity to identify products close to running out of stock. You can also adjust product status rules based on availability and sales speed so customers are in the loop for low-stock items, while you handle restocking.
- Evaluate your sales strategy: Pair product cost data with product sales data to assess whether high-volume sellers also generate healthy gross margins, and to check if you need to shift your sales strategy to prioritize different products.

7. Order Summary Reports: Monitoring Financial Health
This B2B report is the executive’s high-level dashboard, bringing order value and payment status into one clear view. It helps teams understand what customers have ordered, what has been paid, what remains outstanding, and where follow-up may be needed.
What You’ll Learn
- Financial overview: What are the total net value, total tax, and total order value of all orders placed during a chosen period?
- Incoming cash visibility: Review each order’s total value, paid amount, and remaining balance alongside its payment method, payment date, and order status, to understand incoming payments.
- Customer-level payment context: Filter by company name to review order and payment information for a specific customer account.
Apply the Insight
- Optimize payments: View order volume across payment methods, including higher-cost options such as credit cards and lower-cost options such as ACH. Use this data alongside your processing fees to promote more cost-effective options and reconsider more expensive ones.
- Prioritize payment follow-up: Drill down into the data to identify unpaid or partially paid orders and outstanding balances. Filter by company name and relevant order statuses—such as “Awaiting Payment,” “Invoiced,” or “Billed”—to focus on specific accounts that may need follow-up.
- Support monthly accounting: Generate reports containing net value, tax, paid amounts, remaining balances, and payment status to support month-end close procedures. For instance, your accounting team can export the report, total the remaining balances for unpaid and partially paid orders, and compare the result with your accounting records.
8. Orders per Month Reports: Track Business Momentum
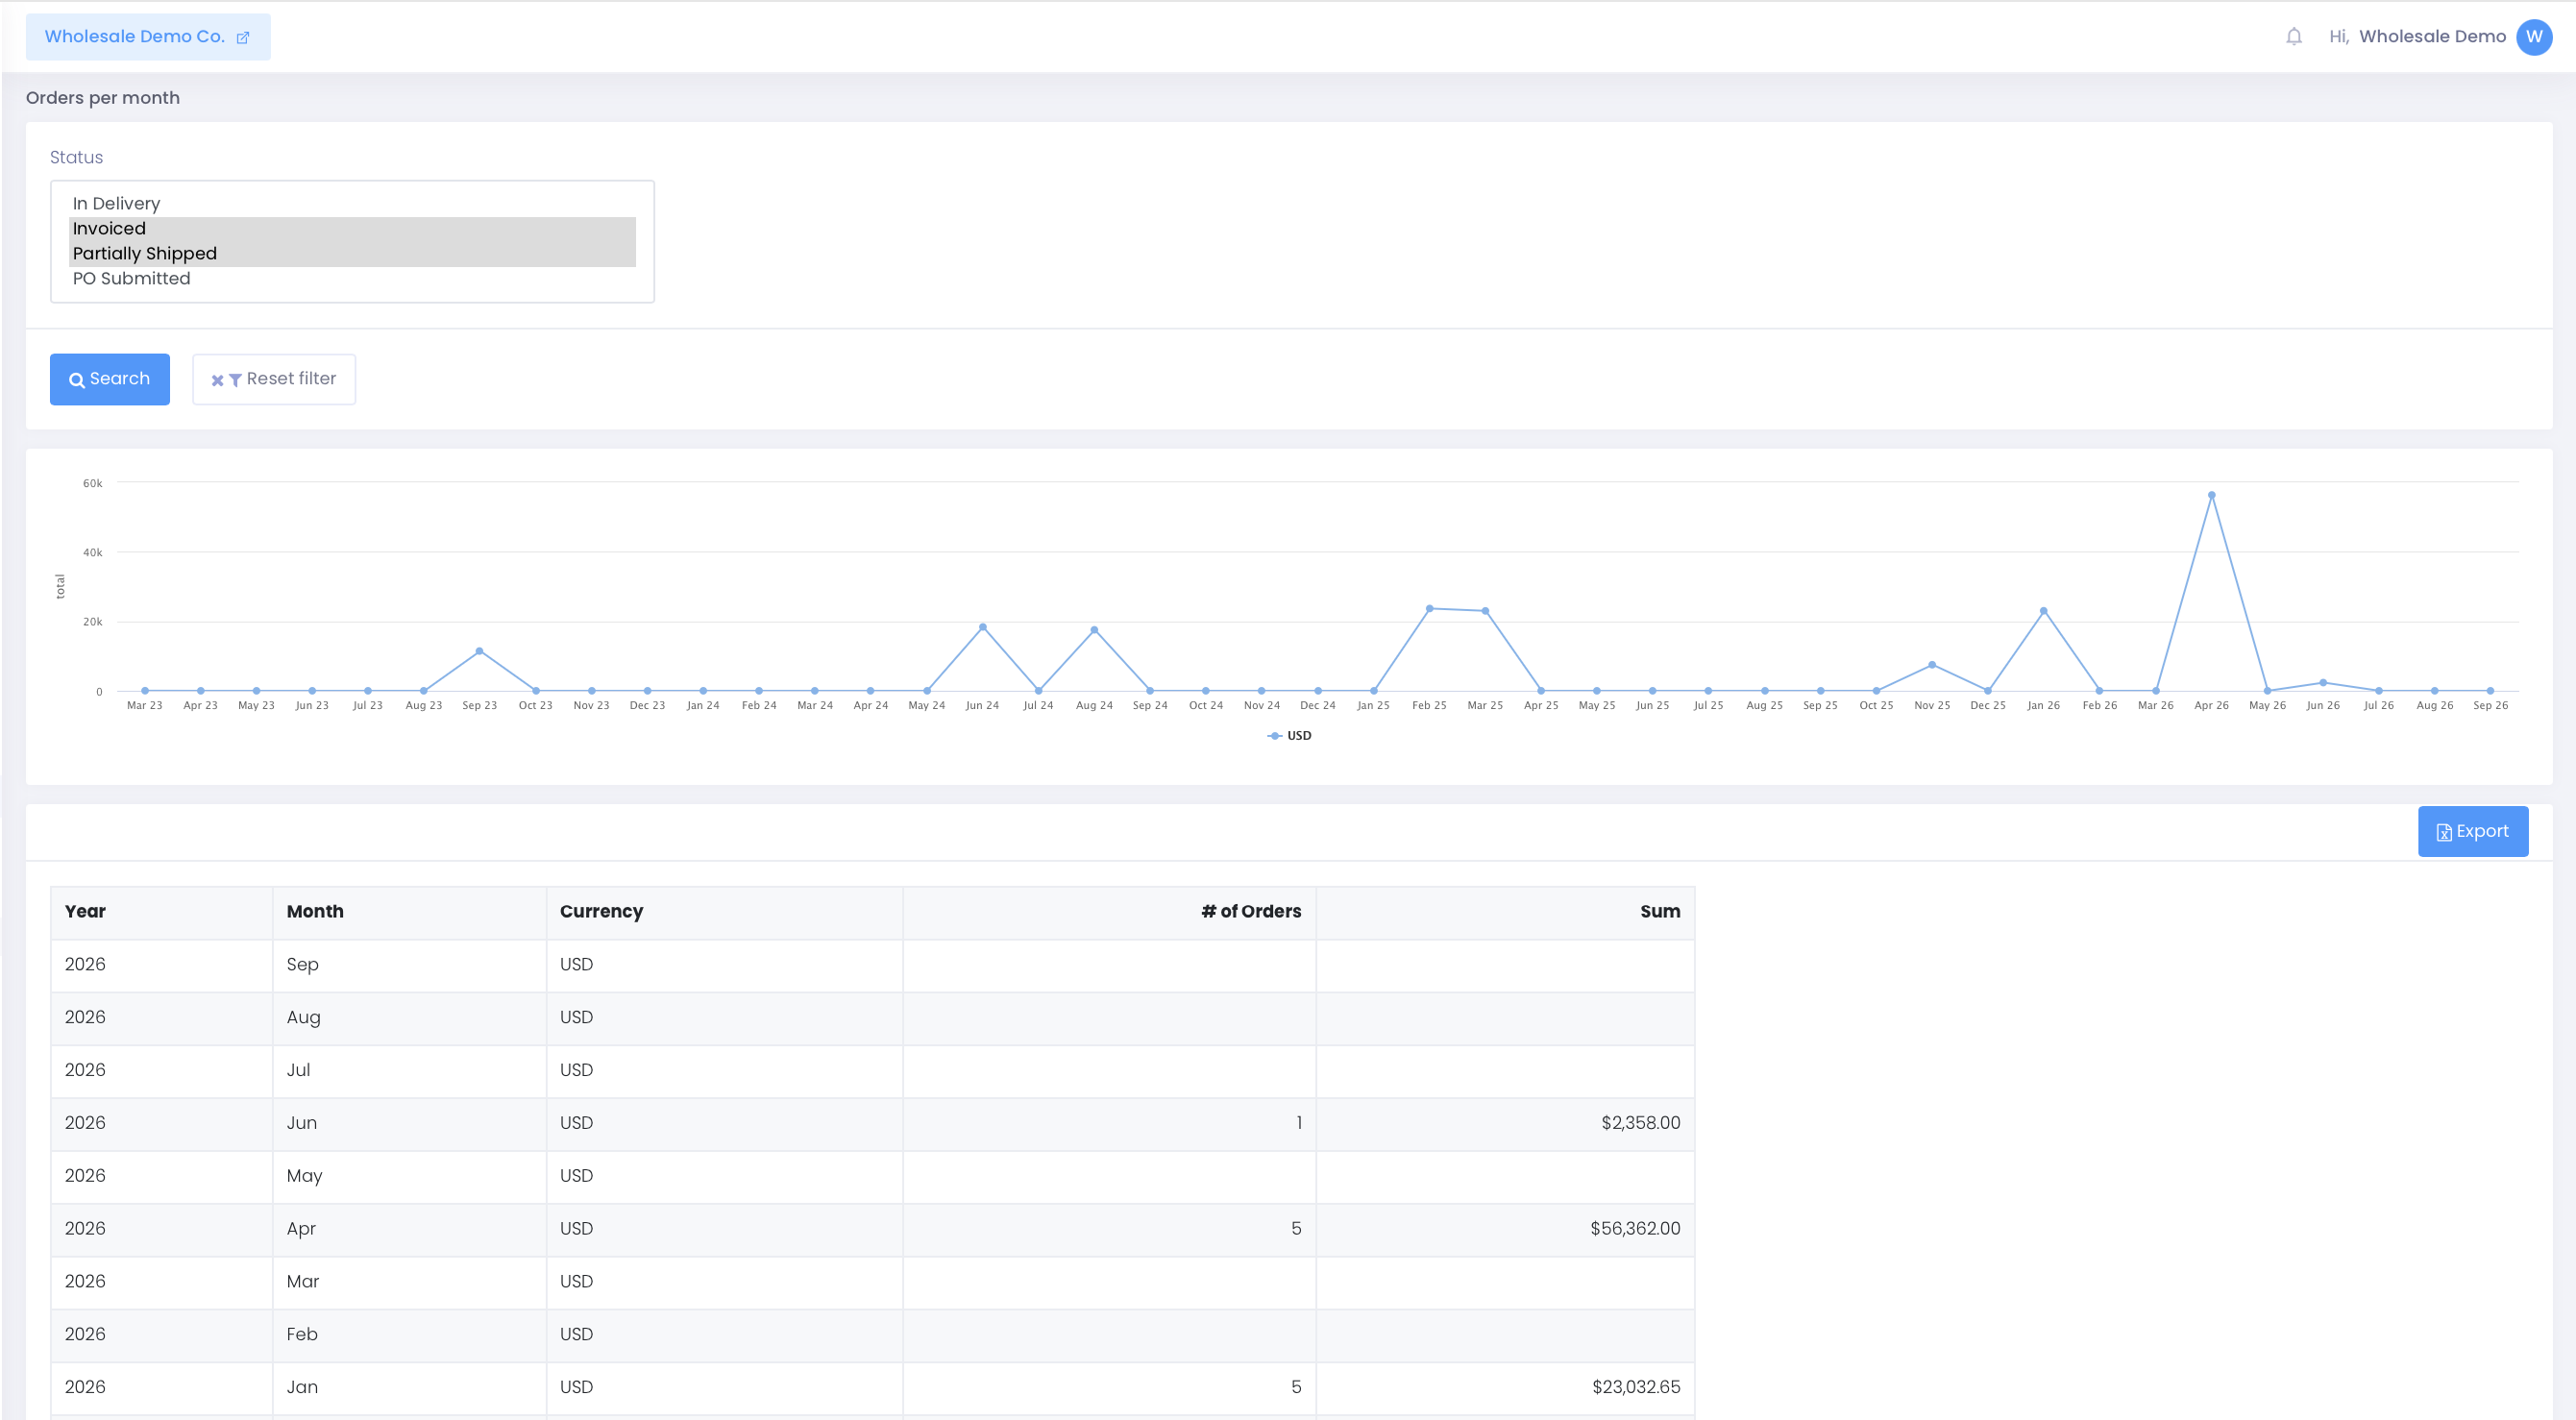
The Orders per Month report complements the more detailed Order Summary report. By showing the number and total value of orders placed through your B2B portal each month, it provides a broader view of how order activity changes over time.
What You’ll Learn
- Order volume trends: See how the number of orders changes across months and years, and filter by one or more order statuses for a more focused view.
- Order value trends: Review total order value from one month to another.
- Seasonal patterns: Identify recurring peaks and slower periods that can support operational and sales planning.
Apply the Insight
- Benchmark performance: Compare current order activity with previous months and the same periods in earlier years.
- Plan ahead: Use recurring monthly order-volume patterns to anticipate busier periods.
- Guide deeper analysis: Use notable changes in monthly order volume or value as a signal to review more detailed customer, product, or order reports for possible causes.
How B2B Wave’s Reporting Tools Turn Data Into Smart Decisions
We’ve talked about core reporting tools. The eight B2B reports discussed above turn raw figures into decisions that inform sales strategy, protect inventory, and support financial oversight.
Our B2B eCommerce platform brings these reports, from Inventory Control to Customer Performance, into a single dashboard. But we don’t stop there. Our wholesale eCommerce solution goes even further, offering advanced insights to keep your business right on course.
- Marketing efforts: Use Coupons Activity to evaluate promotional performance by reviewing coupon usage, discount costs, and the order value associated with each promo.
- Fulfillment efficiency: Monitor Products by Order Status to spot products concentrated in particular order stages and investigate possible fulfillment delays (Reputation saved — crisis averted).
- Operational visibility: Review the Low Quantity and Order Summary by Status Change reports together to understand stock levels and order flow. Decide when to restock, pause supply, or adjust production to keep inventory healthy and operations efficient.
- Business momentum: Use visualization reports, such as Sales per Product per Month and Sales per Category per Month, for instant performance tracking.
Using AI to Ask Follow-Up Questions About Reports: The B2B Wave MCP Server
The reports above give wholesale teams structured ways to monitor sales, customers, orders, and more. But useful insights often lead to follow-up questions or questions that require looking across multiple records. A change in a high-value customer’s activity, for example, might prompt you to ask when they last ordered and what those orders were worth.
Here’s where the B2B Wave Model Context Protocol (MCP) Server comes in. It connects your B2B store with AI Assistants, like Claude, and lets you ask more flexible, meaningful questions using approved data from your portal. Teams can explore information about orders, products, prices, and customers without having to begin with a predefined report each time.
For instance, if your Orders per Month report shows an unexpected decline in March compared with the same month last year, you could ask, “How many orders were canceled this March compared with last March?” The answer may not explain the decline on its own, but it can help narrow the next step in your analysis.
The B2B Wave MCP doesn’t replace built-in reports. Reports provide consistent, repeatable views for monitoring performance, while MCP offers another way to investigate follow-up questions as they arise and gain quick insight into specific trends or patterns.
Seizing Data Opportunities for Sustainable Growth
You’ve seen the evidence: success lies in using the right reports and asking the right questions to understand where you are, where you’re going, and how to get there. That’s the real goal of reporting: to connect people, products, and decisions so your business runs with less friction and more foresight.
B2B reporting tools give you clarity to smooth out operational bumps, unearth hidden business opportunities, and make more profitable decisions.
Platforms like B2B Wave make that process easier, but the principle stays the same: data only matters when it helps you make better choices.
Don’t wait for a lost account or missed opportunity to realize the cost of missing data. See the difference our platform and its built-in reports can make. Book a free demo today.




.svg)

Join fast-growing B2B wholesalers, distributors, and brands who are automating their businesses.
No one does B2B eCommerce like B2B Wave. We’re fast, intuitive, error-free, and integrate with your current stack.
.svg)

.png)

.svg)